Accelerate Your Career with Hands-On learning with this Data Science Course
Welcome to Data Science Hub, your one-stop resource for all things related to data science, machine learning, and artificial intelligence. Whether you're a data scientist, software developer, or just curious about the world of data, our platform provides you with valuable insights, tools, and knowledge to enhance your expertise. Learn how to work with Python, R, SQL, TensorFlow, Pandas, and more, and gain hands-on experience in data analysis, visualization, and predictive modeling to excel in the field of data science.
This course is designed to provide you with comprehensive knowledge of data science technologies and tools, including Python, R, SQL, Pandas, NumPy, Scikit-Learn, TensorFlow, and Tableau, to help you analyze data, build machine learning models, and create data-driven solutions. You will gain hands-on experience in data wrangling, visualization, statistical analysis, and AI model deployment, equipping you with the skills needed to excel in the field of data science and analytics.
Key Features
Get noticed by top companies through EdsoServices JobAssist Program
Hands-on training in data science with real-world applications
Master 15+ in-demand tools, including Python, R, SQL, Pandas, and TensorFlow
1 industry-aligned capstone project for practical learning
Comprehensive blended learning program covering data analysis, visualization, and AI
100+ hours of applied learning with industry case studies
14 lesson-end & 4 phase-end hands-on projects to build a strong portfolio
Skills covered
Python
SQL
Big Data Tools
Matplotlib and seaborn
Neural network
Excel
Tableau
Power BI
Benefits
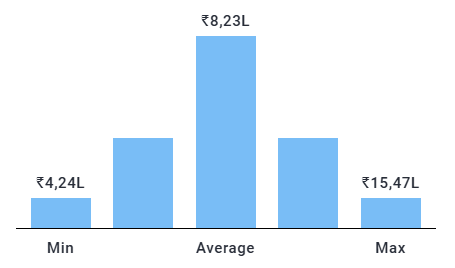
Data Science Course is designed to provide a comprehensive understanding of data analysis, machine learning, AI, and big data technologies. It is one of the top-paying jobs in software development, The one with the Data Science certification can expect to earn an average of ₹13,00,000 per year.
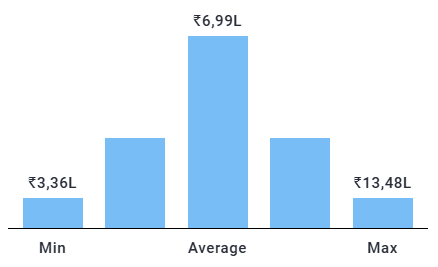
Designation
Data Analayst
Data Engineer
Data Scientist
Data Scientist Consultant
Annual Salary
Source: Glassdoor
Companies
Source: Indeed
Data Science Certification Advantage
EdsoServices Data Science Program provides extensive hands-on training in data analysis, machine learning, and artificial intelligence. This program covers key technologies such as Python, R, SQL, Pandas, NumPy, TensorFlow, and Tableau, equipping you with the skills needed to analyze data and build predictive models. With phase-end and capstone projects based on real-world business scenarios, you'll gain practical experience to excel in the field of data science and analytics.
Fast-Track Your Data Science Career
This comprehensive curriculum covers more than 15 data science tools and technologies to help you stand out as a Data Scientist.
With this program you will:
Learn core data science concepts from leading industry experts with content structured for real-world relevance
Work on real-world datasets to build predictive models and gain hands-on experience
Master key technologies like Python, R, SQL, TensorFlow, Pandas, and Tableau
Earn an industry-recognized course completion certificate
Course Visuals and Comprehensive Previews
Gain a Deeper Understanding through Detailed Lesson Excerpts and Highlights
Data Science Course Videos
Course Syllabus
+
Python Introduction and setting up the environment
Introduction to Programming
R or Python?
Why Python for Data Science?
Different Job Roles with Python
Different Python IDEs
Downloading and Setting up Python Environment
+
Python Basic Syntax and Data Types
Python Input and Output Operations
Comments
Variables, Rules for Naming Variables
Basic Data Types in Python
Typecasting in Python
+
Operators in Python
Arithmetic Operators
Assignment Operators
Comparison Operators
Logical Operators
Identity Operators
Membership Operators
Bitwise Operators
+
Strings in Python
Creating Strings
String Formatting
Indexing
Slicing
String Methods
+
Lists
Creating Lists
Properties of Lists
List Indexing
List Slicing
List of Lists
List Methods
Adding, Updating & Removing Elements from Lists
+
Tuples
Syntax to Create Tuples
Tuple Properties
Indexing on Tuples
Slicing on Tuples
Tuple Methods
+
Sets
Syntax for Creating Sets
Updating Sets
Set Operations and Methods
Difference Between Sets, Lists, and Tuples
+
Dictionaries
Syntax for Creating Dictionaries
Storing Data in Dictionaries
Dictionaries Keys and Values
Accessing the Elements of Dictionaries
Dictionary Methods
+
Python conditional Statements
Setting Logic with Conditional Statements
If Statements
If-Else Statements
If-Elif-Else Statements
+
Loops in Python
Iterating with Python Loops
While Loop
For Loop
Range
Break
Continue
Pass
Enumerate
Zip
Assert
+
Lists and Dictionaries comprehension
Why List Comprehension
Syntax for List Comprehension
Syntax for Dict Comprehension
+
Functions
What are Functions
Modularity and Code Reusability
Creating Functions
Calling Functions
Passing Arguments
Positional Arguments
Keyword Arguments
Variable Length Arguments (*args)
Variable Keyword Length Arguments (**kargs)
Return Keyword in Python
Passing Function as Argument
Passing Function in Return
Global and Local Variables
Recursion
+
Anonymous Function
Lambda
Lambda with Filter
Lambda with Map
Lambda with Reduce
+
Generators
Creating and using generators
+
Modules
Creating Modules
Importing Functions from Different Module
Importing Variables from Different Modules
Python Built-in Modules
+
Packages
Creating Packages
Importing Modules from Package
Different Ways of Importing Modules and Packages
Working on Numpy, Pandas, and Matplotlib
+
Exception and Error Handling
Syntax Errors
Logical Errors
Handling Errors Using Try, Except, and Finally
+
Classes and Objects (OOPS)
Creating Classes & Objects
Attributes and Methods
Understanding __init__ Constructor Method
Class and Instance Attributes
Different Types of Methods
Instance Methods
Class Methods
Static Methods
Inheritance
Creating Child and Parent Class
Overriding Parent Methods
The super() Function
Understanding Types of Inheritance
Single Inheritance
Multiple Inheritance
Multilevel Inheritance
Polymorphism
Operator Overloading
+
Date and Time
Date Module
Time Module
Datetime Module
Time Delta
Formatting Date and Time
strftime()
strptime()
+
Regex
Understanding the Use of Regex
re.search()
re.compile()
re.find()
re.split()
re.sub()
Meta Characters and Their Use
+
Files
Opening Files
Opening Different File Types
Read, Write, Close Files
Opening Files in Different Modes
+
APIs the Unsung Hero of the Connected World
Introduction to APIs
Accessing Public APIs
+
Web Scraping
Installing BeautifulSoup
Understanding Web Structures
Chrome DevTools
Request
Scraping Data from Web Using BeautifulSoup
Scraping Static Websites
Scraping Dynamic Websites Using BeautifulSoup
+
Data analysis EDA using Pandas and NumPy
Introduction to Pandas, a Python Library for Data Manipulation and Analysis
Overview of NumPy, a Fundamental Package for Scientific Computing with Python
Explanation of Key Data Structures in Pandas: Series and DataFrame
Hands-on Exploration of Data Using Pandas to Summarize, Filter, and Transform Data
Data Cleaning Techniques, Handling Missing Values, and Dealing with Outliers
Statistical Analysis of Data Using NumPy Functions
+
Data visualization using Matplotlib, Seaborn, and Plotly
Introduction to Data Visualization and Its Importance in Data Analysis
Overview of Matplotlib, a Popular Plotting Library in Python
Exploring Different Types of Plots: Line Plots, Scatter Plots, Bar Plots, Histogram, etc.
Customizing Plots with Labels, Titles, Colors, and Styles
Introduction to Seaborn, a Python Data Visualization Library Based on Matplotlib
Advanced Plotting Techniques with Seaborn: Heatmaps, Pair Plots, and Categorical Plots
Introduction to Plotly, an Interactive Plotting Library for Creating Web-based Visualizations
Creating Interactive and Dynamic Visualizations with Plotly
+
Database Access
Introduction to Databases
Why SQL?
Execution of an SQL Statement
Installing MySQL
Load Data
USE, DESCRIBE, SHOW Table
SELECT
LIMIT, OFFSET
ORDER BY
DISTINCT
WHERE, Comparison Operators, NULL
Logical Operators
Aggregate Functions: COUNT, MIN, MAX, AVG, SUM
GROUP BY
HAVING
Order of Keywords
JOIN and NATURAL JOIN
INNER, LEFT, RIGHT, and OUTER JOINS
Sub Queries/Nested Queries/Inner Queries
DML: INSERT
DML: UPDATE, DELETE
DML: CREATE, TABLE
DDL: ALTER, ADD, MODIFY, DROP
DDL: DROP TABLE, TRUNCATE, DELETE
Data Control Language: GRANT, REVOKE
+
MS Excel
Excel Introduction
Workbook Window
Create & Open Workbooks
MS Excel Online
Excel vs Google Sheets
Office Button
Ribbon and Tabs
Features of Tabs
Quick Access Toolbar
Mini Toolbar
Title, Help, Zoom, View
+
Excel Worksheet
Worksheet, Row, Column
Moving on Worksheet
Enter Data
Select Data
Delete Data
Move Data
Copy Paste Data
Spell Check
Insert Symbols
+
Excel Calculation
Addition
Sigma Addition
Subtraction
Calculate Average
Sigma Average
+
Excel Fill Handle
Fill Handle
Fill Handle with Text
Text with Numbers
Fill Handle with Dates
+
Excel Formula
Create Formula Open Link
Fill Handle in Formula
Relative Referencing
Absolute Referencing
Instruction for Typing
+
Quick Excel Functions
Excel IF
If Function
If with Calculations
Excel COUNTIF
Advanced If
WHAT IF Analysis
+
Excel Charts and visualizations
Introduction to Excel Charts
Dynamic Advanced Charts
Pivot Table with Dashboard
Advanced Pivot Table Tips & Tricks
+
Excel Advanced
Excel Macros
Excel SUMIF
Excel VLOOKUP
Excel ISNA
Find & Remove Duplicates
Create Drop-down List
Merge Cells in Excel
+
Tableau
Building Bar Charts and Line Charts
Creating Pie Charts and Scatter Plots
Designing Basic Maps and Geographic Visualizations
Using Filters to Subset Data
Sorting Data by Different Criteria
Applying Quick Filters for Interactive Exploration
Adding Labels, Tooltips, and Colors to Visualizations
Formatting Axes and Gridlines
Customizing Visual Elements for Better Presentation
Combining Multiple Visualizations into a Dashboard
Adding Interactivity with Filters and Actions
Arranging and Organizing Dashboard Elements
Publishing Dashboards to Tableau Public or Tableau Server
Embedding Dashboards in Websites or Presentations
Presenting and Sharing Dashboards Effectively
+
Power Bl
Overview of Power BI and Its Features
Understanding the Power BI Interface
Connecting to Data Sources
Importing and Transforming Data
Creating Bar Charts and Line Charts
Designing Pie Charts and Scatter Plots
Building Basic Tables and Matrices
Using Filters and Slicers to Subset Data
Adding Interactivity to Visualizations
Sorting and Formatting Data
Building Interactive Dashboards with Multiple Visualizations
Adding Filters and Slicers for User Interactivity
Formatting and Organizing Dashboard Elements
Publishing Reports to the Power BI Service
Sharing Reports and Dashboards with Others
Configuring Security and Access Controls
+
Descriptive Statistics
Data Types of Data
A Measure of Central Tendency – Mean, Median, Mode
A Measure of Shape – Variance, Standard Deviation, Range, IQR
Probability – Events, Sample Space, Mutually Exclusive Events
Classical and Conditional Probability
Probability Distribution – Discrete and Continuous
Uniform Distribution
Expected Values, Variance, and Means
Gaussian/Normal Distribution
Properties, Mean, Variance, Empirical Rule of Normal Distribution
Standard Normal Distribution and Z-Score
+
Inferential Statistics
Central Limit Theorem
Hypothesis Testing – Null and Alternate Hypothesis, Type I and Type II Error
Critical Value, Significance Level, p-value
One-Tailed and Two-Tailed Test
T-test – One Sample, Two-Sample, and Paired T-test
F-test
One-Way and Two-Way ANOVA
Chi-Square Test
+
Introduction to Machine Learning
Introduction to Machine Learning and its types (supervised, unsupervised, reinforcement learning)
Setting up the development environment {Python, Jupyter Notebook, libraries: NumPy, Pandas, Scikit-learn}
Overview of the Machine Learning workflow and common data preprocessing techniques
+
Introduction to data science and its applications
Definition of Data Science and its Role in Various Industries
Explanation of the Data Science Lifecycle and its Key Stages
Overview of the Different Types of Data: Structured, Unstructured, and Semi-structured
Discussion of the Importance of Data Collection, Data Quality, and Data Preprocessing
+
Data Engineering and Preprocessing
Introduction to Data Engineering: Data Cleaning, Transformation, and Integration
Data Cleaning and Handling Missing Values: Imputation, Deletion, and Outlier Treatment
Feature Engineering Techniques: Creating New Features, Handling Date and Time Variables, and Encoding Categorical Variables
Data Scaling and Normalization: Standardization, Min-Max Scaling, etc.
Dealing with Categorical Variables: One-Hot Encoding, Label Encoding, etc.
+
Model Evaluation and Hyperparameter Tuning
Cross-validation and Model Evaluation Techniques
Hyperparameter Tuning using GridSearchCV and RandomizedSearchCV
Model Selection and Comparison
+
Supervised Learning – Regression
Introduction to Regression: Definition, Types, and Use Cases
Linear Regression: Theory, Cost Function, Gradient Descent, Residual Analysis, Q-Q Plot, Interaction Terms, and Assumptions
Polynomial Regression: Adding Polynomial Terms, Degree Selection, and Overfitting
Lasso and Ridge Regression: Regularization Techniques for Controlling Model Complexity
Evaluation Metrics for Regression Models: Mean Squared Error (MSE), R-squared, and Mean Absolute Error (MAE)
+
Supervised Learning – Classification
Introduction to Classification: Definition, Types, and Use Cases
Logistic Regression: Theory, Logistic Function, Binary and Multiclass Classification
Decision Trees: Construction, Splitting Criteria, Pruning, and Visualization
Random Forests: Ensemble Learning, Bagging, and Feature Importance
Evaluation Metrics for Classification Models: Accuracy, Precision, Recall, F-Score, and ROC Curves
Implementation of Classification Models using Scikit-learn Library
+
SVM, KNN & Naive Bayes
Support Vector Machines (SVM): Study SVM Theory, Different Kernel Functions (Linear, Polynomial, Radial Basis Function), and the Margin Concept. Implement SVM Classification and Regression, and Evaluate the Models.
K-Nearest Neighbors (KNN): Understand the KNN Algorithm, Distance Metrics, and the Concept of K in KNN. Implement KNN Classification and Regression, and Evaluate the Models.
Naive Bayes: Learn about the Naive Bayes Algorithm, Conditional Probability, and Bayes' Theorem. Implement Naive Bayes Classification, and Evaluate the Model's Performance.
+
Ensemble Methods and Boosting
AdaBoost: Boosting Technique, Weak Learners, and Iterative Weight Adjustment
Gradient Boosting (XGBoost): Gradient Boosting Algorithm, Regularization, and Hyperparameter Tuning
Evaluation and Fine-Tuning of Ensemble Models: Cross-Validation, Grid Search, and Model Selection
Handling Imbalanced Datasets: Techniques for Dealing with Class Imbalance, such as Oversampling and Undersampling
+
Unsupervised Learning – Clustering
Introduction to Clustering: Definition, Types, and Use Cases
K-means Clustering: Algorithm Steps, Initialization Methods, and Elbow Method for Determining the Number of Clusters
DBSCAN (Density-Based Spatial Clustering of Applications with Noise): Core Points, Density Reachability, and Epsilon-Neighborhoods
Evaluation of Clustering Algorithms: Silhouette Score, Cohesion, and Separation Metrics
+
Unsupervised Learning – Dimensionality Reduction
Introduction to Dimensionality Reduction: Curse of Dimensionality, Feature Extraction, and Feature Selection
Principal Component Analysis (PCA): Eigenvectors, Eigenvalues, Variance Explained, and Dimensionality Reduction
Implementation of PCA using Scikit-learn Library
+
Recommendation Systems
Introduction to Recommendation Systems: Understand the Concept of Recommendation Systems, Different Types (Collaborative Filtering, Content-Based, Hybrid), and Evaluation Metrics
Collaborative Filtering: Explore Collaborative Filtering Techniques, Including User-Based and Item-Based Approaches, and Implement a Collaborative Filtering Model
Content-Based Filtering: Study Content-Based Filtering Methods, such as TF-IDF and Cosine Similarity, and Build a Content-Based Recommendation System
Deployment and Future Directions: Discuss the Deployment of Recommendation Systems and Explore Advanced Topics in NLP and Recommendation Systems
+
Reinforcement Learning
Introduction to Reinforcement Learning: Agent, Environment, State, Action, and Reward
Markov Decision Processes (MDP): Markov Property, Transition Probabilities, and Value Functions
Q-Learning Algorithm: Exploration vs. Exploitation, Q-table, and Learning Rate
Hands-on Reinforcement Learning Projects and Exercises
+
Developing API using Flask / Webapp with Streamlit
Introduction to Flask/Streamlit Web Framework
Creating a Flask/Streamlit Application for ML Model Deployment
Integrating Data Preprocessing and ML Model
Designing a User-Friendly Web Interface
+
Deployment of ML Models
Building a Web Application for Machine Learning Models: Creating Forms, Handling User Input, and Displaying Results
Deployment using AWS (Amazon Web Services): Setting up an AWS Instance, Configuring Security Groups, and Deploying the Application
Deployment using PythonAnywhere: Uploading Flask Application Files, Configuring WSGI, and Launching the Application
+
Project Work and Consolidation
Work on a Real-World Machine Learning Project: Identify a Problem, Gather Data, and Define Project Scope
Apply the Learned Concepts and Algorithms: Data Collection, Preprocessing, Model Building, and Evaluation
Deployment of the Project on AWS or PythonAnywhere: Showcase the Developed Application and Share the Project with Others
Presentation and Discussion of the Project: Demonstrate the Project, Explain Design Decisions, and Receive Feedback
+
Natural Language Processing NLP
Introduction to NLP: Understand the Basics of NLP, Its Applications, and Challenges
Named Entity Recognition (NER): Understand the Various Approaches and Tools Used for NER, such as Rule-Based Systems, Statistical Models, and Deep Learning
Text Preprocessing: Learn About Tokenization, Stemming, Lemmatization, Stop Word Removal, and Other Techniques for Text Preprocessing
Text Representation: Explore Techniques such as Bag-of-Words (BoW), TF-IDF, and Word Embeddings (e.g., Word2Vec, GloVe) for Representing Text Data
Sequential Models: Introduction to RNN, LSTM, Hands-On Keras LSTM
Sentiment Analysis: Study Sentiment Analysis Techniques, Build a Sentiment Analysis Model Using Supervised Learning, and Evaluate Its Performance
Introduction to Machine Learning and its types (supervised, unsupervised, reinforcement learning)
Setting up the development environment {Python, Jupyter Notebook, libraries: NumPy, Pandas, Scikit-learn}
Overview of the Machine Learning workflow and common data preprocessing techniques
+
Real Time Drowsiness Detection Alert System
Dataset Collection
Data Preprocessing
Feature Extraction
Labeling
Model Selection
Model Training
Model Evaluation
Real-time Implementation
Alert Mechanism
Continuous Improvement
+
House Price Prediction using LSTM
Identify a Reliable Source for House Price Data
Understand the Website Structure
Perform Web Scraping
Preprocess the Scraped Data
Explore and Preprocess Additional Data Sources (if applicable)
Define the Problem
Split the Data
Train the Model
Evaluate the Model
Fine-tune the Model (Optional)
Deploy the Model
Continuously Update the Dataset and Retrain the Model
+
Customizable Chabot using OpenAI API
Define Chatbot Goals and Scope
Gather Training Data
Data Preprocessing
API Integration
Model Customization
User Input Handling
Response Generation
Post-processing and Filtering
Error Handling and Fallback Mechanisms
Continuous Improvement
+
Fire and Smoke Detection using CNN
Data Collection
Data Preprocessing
Dataset Augmentation
Model Architecture
Training
Model Evaluation
Fine-tuning
Real-time Inference
Thresholding and Alerts
Model Optimization
Talk to Our Advisor
400 + Placement
The Edso Services facilitated over 400 job placements till 2024, solidifying their reputation as the best placement partner in recent years.
Data Science Course Review
Data Scientist
"The Data Science course at Edso Services covered everything from the basics of data manipulation using Pandas to advanced machine learning algorithms. The step-by-step approach helped me build a strong foundation in both theory and practical skills."
Data Analyst
"What stood out for me was the hands-on approach. We worked on real-world datasets, analyzed them using Python, and implemented machine learning models like regression and classification. It was very fulfilling to apply the concepts in practical projects."
Data Engineer
"The instructors were very knowledgeable and explained complex topics like neural networks and deep learning in an easy-to-understand way. They were always available to clarify doubts and provided helpful resources for further learning."
Machine Learning Engineer
"I learned how to work with industry-standard tools like Jupyter Notebooks, Scikit-learn, and TensorFlow. The course also covered data visualization techniques using Matplotlib and Seaborn, which were really useful for presenting findings effectively."
Senior Data Scientist
"The course not only focused on technical skills but also on building a portfolio of projects. Edso Services helped me improve my resume, provided mock interviews, and connected me to job opportunities, which was extremely valuable in securing my first Data Science role."
Frequently Asked Questions (FAQ)
What is Data Science with Python Certification?
Data Science with Python certification is a credential that demonstrates expertise in using Python for data analysis, machine learning, and data visualization. To get certified, you must complete the coursework and pass an exam that covers topics such as statistical analysis, data manipulation with libraries like Pandas and NumPy, and building predictive models with ML tools. Edso Services Applied Data Science with Python training helps data scientists apply Python skills to solve real-world data problems.
What skills should a data science expert know?
With data science being a very in-demand role, an expert in this field should possess the following skills:
Data Wrangling
Data Visualization
Web Scraping
Python Programming Concepts
ScikitLearn Package for Natural Language Processing
Data Exploration
Mathematical Computing
Our Applied Data Science with Python course will help you gain all the above skills and have a flourishing career as a data scientist.
What industries use data science the most?
Data science has applications in every industry. However, some industries use it more extensively. These include:
Retail
Healthcare
Banking and Finance
Construction
Communications
Media and Entertainment
Education
Energy and Utility
Will missing a live class affect my ability to complete the course?
No, missing a live class will not affect your ability to complete the course. With our 'flexi-learn' feature, you can watch the recorded session of any missed class at your convenience. This allows you to stay up-to-date with the course content and meet the necessary requirements to progress and earn your certificate. Simply visit the Edso Services learning platform, select the missed class, and watch the recording to have your attendance marked.
What does a data scientist with Python skills do?
A data scientist adept at Python can use its programming language to analyze and interpret complex data sets. They develop and apply statistical machine learning models, ML algorithms, and data visualization techniques to extract insights. Data scientists proficient with the tool also use Python libraries like Pandas, NumPy, and Scikit-learn for data cleaning, predictive modeling, and creating interactive visualizations.
What are the benefits of enrolling in the Applied Data Science with Python course?
Python is the most popular programming language for learning Data Science. In fact, it's widely used to perform data analysis, data manipulation, and data visualization. Enrolling in the Applied Python Data Science course will help you learn data science with python fundamentals while also providing more benefits like:
Over 60 hours of blended learning
Lifetime access to self-paced learning content
Exposure to industry-based projects for experiential learning
Interactive learning with Jupyter notebooks labs
Access to 40+ assisted practices and lesson-wise knowledge checks
Who are the instructors for this data science with Python course, and how are they selected?
The instructors for this data science with Python course are industry experts with extensive experience in the field. They are selected based on expertise, industry recognition, and teaching ability to ensure you receive top-quality education and insights.
What is the career path after completing the Python Data Science Course?
Completing this Applied Data Science with Python course from Edso Services will help you explore the most in-demand roles in the current job market. With this training, you can explore roles such as junior data scientist, data analyst, or machine learning engineer. If you possess over four years of experience in this field, you can also get into positions like senior data scientist, data engineer, or analytics consultant.
As a senior data scientist, you can work on advanced data projects, develop sophisticated models, and contribute to strategic business decisions. With further experience and specialization, you can explore roles in data strategy, research, or leadership.
What are the job roles available after obtaining a Data Science with Python certification?
After getting a data science with python certification, you can work as a:


 Get noticed by top companies through EdsoServices JobAssist Program